
Salon reports and analytics
The reports in the Stamly portal are built from the appointments you've checked out. They show what the salon earned, who came back and when chairs sit empty, without you stitching together figures from the till and the appointment book.
Reports at a glance
- Reports have six tabs: Overview, Revenue, Bookings, Customers, Loyalty and Staff.
- Revenue is what customers paid. A completed appointment only counts once it's been checked out.
- Choose a period and a location, and compare with the previous period or the same period last year.
- The whole report downloads as one CSV file that opens in Excel.
Monday morning with last month's figures
The owner opens Reports before the first customer. The figures are made up, but the buttons and labels are the ones in the portal.
Reports
Portal08:12
Period: Last month · Compare with the previous period
Revenue08:12
NOK 312,400, up 6% on the month before
Insights and recommendations08:13
Friday 14:00–17:00 is busiest
Insights and recommendations08:13
41 customers haven't visited the salon in 90 days
Kari, owner08:15
Tapped “Send campaign” and set up a send to them
Portal08:16
Export report · the CSV file has downloaded
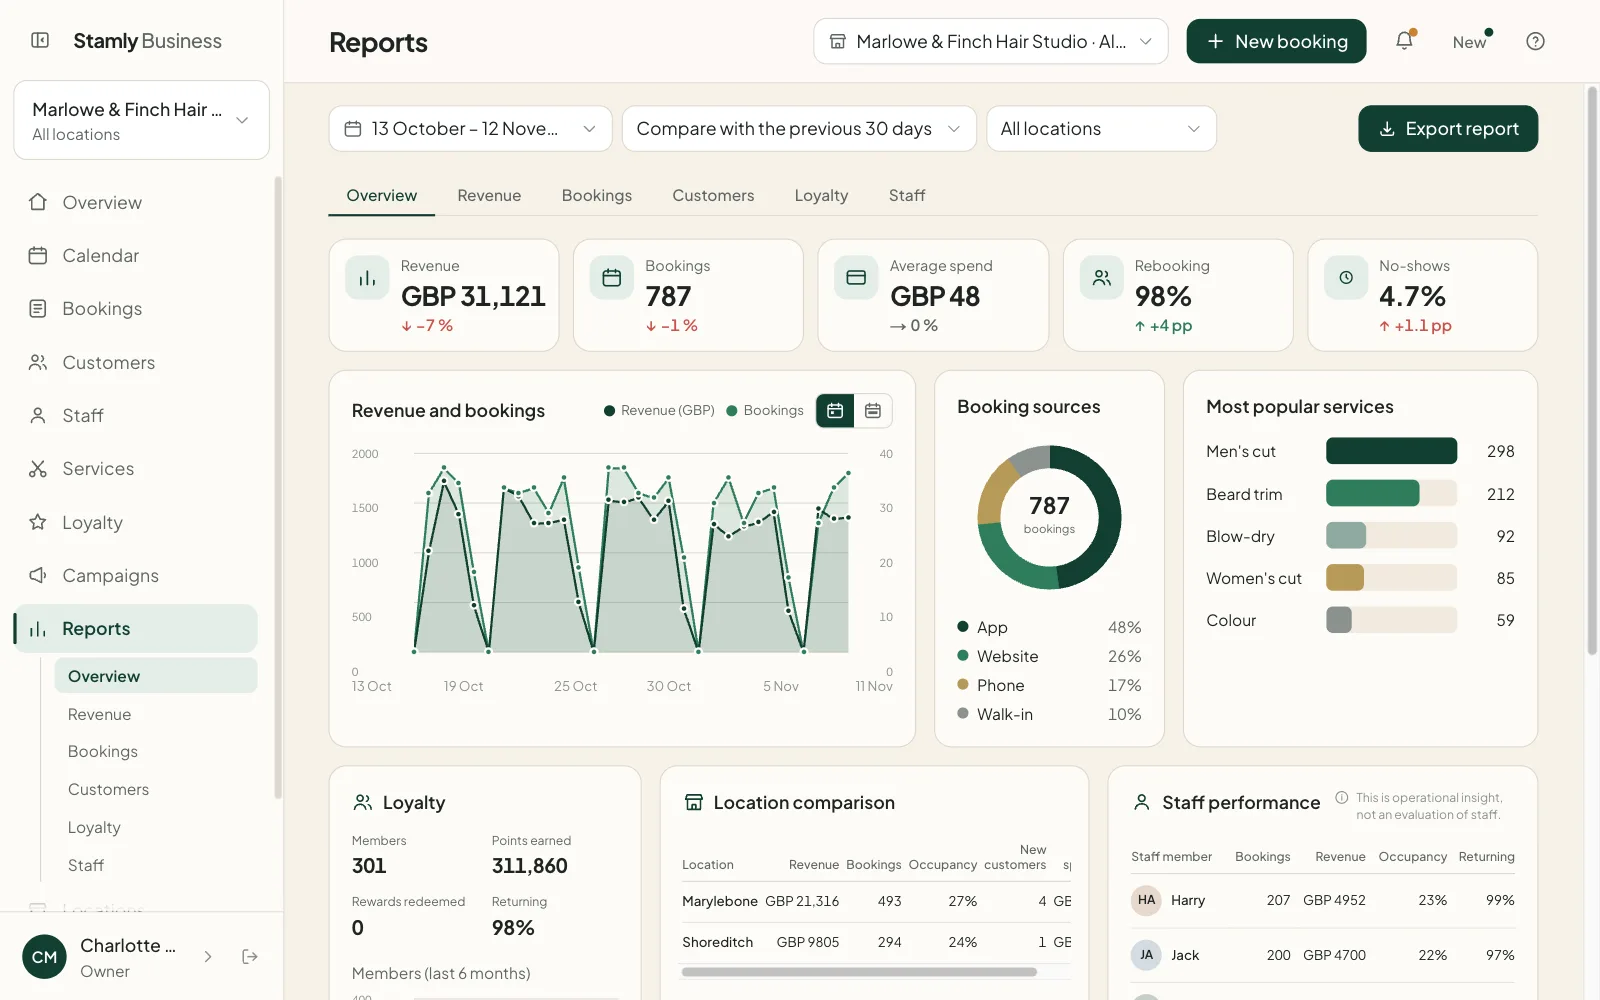

The key figures at the top
The report opens with revenue, bookings, average spend, rebooking, new customers and no-shows. If you've chosen a comparison, each figure gets an arrow showing the change. Shares such as rebooking are compared in percentage points, so a rise from 40 to 44 per cent shows as 4, not 10.
The Bookings tab shows where appointments came from: the app, the website, the portal, the phone, walk-ins or an import. Watch it during your first weeks with online booking. If customers are still ringing, you'll see it here.
Revenue means what the customer paid, as recorded when the appointment was checked out. If a stylist has completed an appointment without checking it out, it's listed separately with a count and an amount, and joins revenue once checkout is recorded. Unpaid appointments never inflate the total.
Revenue per stylist, without a league table
The Staff tab lists each stylist with their number of appointments, revenue, occupancy and share of returning customers for the period. Occupancy is measured against ten hours a day for one chair, not against that person's shifts. Someone who works part-time will show lower occupancy, and that says nothing about how good they are.
The portal spells this out above the table: this is operational insight, not an evaluation of staff. Use it to check whether a new stylist is getting enough customers in their first months, or whether one chair is full while another has gaps in the middle of the day.
Insights that point to something you can do
The overview has a panel called Insights and recommendations. It finds the busiest three-hour window of the week, measured in booked minutes. Four colour services therefore weigh more than six beard trims, because the chair is what's in short supply.
It also counts customers who have been in before, have agreed to marketing and haven't visited for 90 days, with a Send campaign button right next to the number. And it shows which service most often leads to another booking within eight weeks. When every service scores about the same, it says so rather than crowning a winner.
Several locations in one report
If the salon has more than one location, you pick the location at the top of the page. The overview includes a location comparison, and the Customers tab shows new customers by location. A new customer is counted at the location they've set as their favourite, not wherever they happened to go first.
Reports are in the menu for the owner and for location managers. The owner can see every location together. A location manager sees only their own, one at a time.
From report to spreadsheet
Export report gives you one CSV file with every section stacked in order: key figures, booking sources, the most booked services and the rest. The separator follows the portal's language, commas in English and semicolons in Norwegian, so Excel opens it in columns. Your chosen period, comparison and location come with it.
The client database and the list of bookings can each be downloaded from their own pages.
Reports: common questions
Can I see revenue per stylist in Stamly?
Yes. The Staff tab under Reports shows appointments, revenue, occupancy and returning customers for each staff member over the period you choose.
Why is revenue in the report lower than what was booked?
Reports only count what customers have paid, as recorded at checkout. Completed appointments that haven't been checked out are shown separately, with a count and an amount, until checkout is recorded.
Which periods can the reports show?
This month, last month, the last 7, 30 or 90 days, and this year. Each one can be compared with the previous period or with the same period last year.
Can the reports be opened in Excel?
Yes. The report downloads as a single CSV file, separated by commas when the portal is in English and by semicolons when it's in Norwegian. Every part of the report is in that one file.
Who in the salon can see the reports?
Reports are in the portal menu for the owner and location managers. Receptionists and other staff don't have them in their menu.
Does Stamly replace accounting software?
No. Stamly shows how the salon is doing and revenue per appointment, but it doesn't take customer payments or keep the books. You can send the CSV file on to your accountant.
More features for your salon
See how booking, customers, staff and loyalty fit together in Stamly.
See all of Stamly for your salon
Appointment book, customers, staff, loyalty and the overview, in one platform.